Empire OS Trading Fully Automated Prop Firm Ready💎 Prop-Firm-Ready Momentum System v3 — The Gold-Mine Algorithm 💎
Engineered for the same standards that top prop firms demand — minimal drawdown, consistent equity growth, and precision-based execution. This isn’t a basic indicator; it’s a refined momentum engine built for traders who scale capital and manage risk like professionals.
Performance Snapshot
• Profit Factor 2.26 • Win Rate 33 % • Max Drawdown 0.9 % • Total P/L + $447 • W/L Ratio 4.6 : 1
Stress-tested on Gold (XAUUSD) across live-market conditions, it stays composed under volatility and delivers structured, data-driven consistency.
⚡ See it. Test it. Scale it.
Built for prop-firm precision — from $10 K to $300 K and beyond.
[b]forex

EMA 9/50 News Confirmation Strategy v3 (Trend Aligned 3 bMin) “EMA 9/50 crossover strategy with trend filter and ATR-based targets”)

FluxVector Liquidity Universal Trendline FluxVector Liquidity Trendline FFTL
Summary in one paragraph
FFTL is a single adaptive trendline for stocks ETFs FX crypto and indices on one minute to daily. It fires only when price action pressure and volatility curvature align. It is original because it fuses a directional liquidity pulse from candle geometry and normalized volume with realized volatility curvature and an impact efficiency term to modulate a Kalman like state without ATR VWAP or moving averages. Add it to a clean chart and use the colored line plus alerts. Shapes can move while a bar is open and settle on close. For conservative alerts select on bar close.
Scope and intent
• Markets. Major FX pairs index futures large cap equities liquid crypto top ETFs
• Timeframes. One minute to daily
• Default demo used in the publication. SPY on 30min
• Purpose. Reduce false flips and chop by gating the line reaction to noise and by using a one bar projection
• Limits. This is a strategy. Orders are simulated on standard candles only
Originality and usefulness
• Unique fusion. Directional Liquidity Pulse plus Volatility Curvature plus Impact Efficiency drives an adaptive gain for a one dimensional state
• Failure mode addressed. One or two shock candles that break ordinary trendlines and saw chop in flat regimes
• Testability. All windows and gains are inputs
• Portable yardstick. Returns use natural log units and range is bar high minus low
• Protected scripts. Not used. Method disclosed plainly here
Method overview in plain language
Base measures
• Return basis. Natural log of close over prior close. Average absolute return over a window is a unit of motion
Components
• Directional Liquidity Pulse DLP. Measures signed participation from body and wick imbalance scaled by normalized volume and variance stabilized
• Volatility Curvature. Second difference of realized volatility from returns highlights expansion or compression
• Impact Efficiency. Price change per unit range and volume boosts gain during efficient moves
• Energy score. Z scores of the above form a single energy that controls the state gain
• One bar projection. Current slope extended by one bar for anticipatory checks
Fusion rule
Weighted sum inside the energy score then logistic mapping to a gain between k min and k max. The state updates toward price plus a small flow push.
Signal rule
• Long suggestion and order when close is below trend and the one bar projection is above the trend
• Short suggestion and flip when close is above trend and the one bar projection is below the trend
• WAIT is implicit when neither condition holds
• In position states end on the opposite condition
What you will see on the chart
• Colored trendline teal for rising red for falling gray for flat
• Optional projection line one bar ahead
• Optional background can be enabled in code
• Alerts on price cross and on slope flips
Inputs with guidance
Setup
• Price source. Close by default
Logic
• Flow window. Typical range 20 to 80. Higher smooths the pulse and reduces flips
• Vol window. Typical range 30 to 120. Higher calms curvature
• Energy window. Typical range 20 to 80. Higher slows regime changes
• Min gain and Max gain. Raise max to react faster. Raise min to keep momentum in chop
UI
• Show 1 bar projection. Colors for up down flat
Properties visible in this publication
• Initial capital 25000
• Base currency USD
• Commission percent 0.03
• Slippage 5
• Default order size method percent of equity value 3%
• Pyramiding 0
• Process orders on close off
• Calc on every tick off
• Recalculate after order is filled off
Realism and responsible publication
• No performance claims
• Intrabar reminder. Shapes can move while a bar forms and settle on close
• Strategy uses standard candles only
Honest limitations and failure modes
• Sudden gaps and thin liquidity can still produce fast flips
• Very quiet regimes reduce contrast. Use larger windows and lower max gain
• Session time uses the exchange time of the chart if you enable any windows later
• Past results never guarantee future outcomes
Open source reuse and credits
• None

DayFlow VWAP Relay Forex Majors StrategySummary in one paragraph
DayFlow VWAP Relay is a day-trading strategy for major FX pairs on intraday timeframes, demonstrated on EURUSD 15 minutes. It waits for alignment between a daily anchored VWAP regime check, residual percentiles, and lower-timeframe micro flow before suggesting trades. The originality is the fusion of daily VWAP residual percentiles with a live micro-flow score from 1 minute data to switch between fade and breakout behavior inside the same session. Add it to a clean chart and use the markers and alerts.
Scope and intent
• Markets: Major FX pairs such as EURUSD, GBPUSD, USDJPY, AUDUSD, USDCHF, USDCAD
• Timeframes: One minute to one hour
• Default demo in this publication: EURUSD on 15 minutes
• Purpose: Reduce false starts by acting only when context, location and micro flow agree
• Limits: This is a strategy. Orders are simulated on standard candles only
Originality and usefulness
• Core novelty: Residual percentiles to daily anchored VWAP decide “balanced versus expanding day”. A separate 1 minute micro-flow score confirms direction, so the same model fades extremes in balance and rides range breaks in expansion
• Failure modes addressed: Chop fakeouts and unconfirmed breakouts are filtered by the expansion gate and micro-flow threshold
• Testability: Every input is exposed. Bands, background regime color, and markers show why a suggestion appears
• Portable yardstick: Stops and targets are ATR multiples converted to ticks, which transfer across symbols
• Open source status: No reused third-party code that requires attribution
Method overview in plain language
The day is anchored with a VWAP that updates from the daily session start. Price minus VWAP is the residual. Percentiles of that residual measured over a rolling window define location extremes for the current day. A regime score compares residual volatility to price volatility. When expansion is low, the day is treated as balanced and the model fades residual extremes if 1 minute micro flow points back to VWAP. When expansion is high, the model trades breakouts outside the VWAP bands if slope and micro flow agree with the move.
Base measures
• Range basis: True Range smoothed by ATR for stops and targets, length 14
• Return basis: Not required for signals; residuals are absolute price distance to VWAP
Components
• Daily Anchor VWAP Bands. VWAP with standard-deviation bands. Slope sign is used for trend confirmation on breakouts
• Residual Percentiles. Rolling percentiles of close minus VWAP over Signal length. Identify location extremes inside the day
• Expansion Ratio. Standard deviation of residuals divided by standard deviation of price over Signal length. Classifies balanced versus expanding day
• Micro Flow. Net up minus down closes from 1 minute data across a short span, normalized to −1..+1. Confirms direction and avoids fades against pressure
• Session Window optional. Restricts trading to your configured hours to avoid thin periods
• Cooldown optional. Bars to wait after a position closes to prevent immediate re-entry
Fusion rule
Gating rather than weighting. First choose regime by Expansion Ratio versus the Expansion gate. Inside each regime all listed conditions must be true: location test plus micro-flow threshold plus session window plus cooldown. Breakouts also require VWAP slope alignment.
Signal rule
• Long suggestion on balanced day: residual at or below the lower percentile and micro flow positive above the gate while inside session and cooldown is satisfied
• Short suggestion on balanced day: residual at or above the upper percentile and micro flow negative below the gate while inside session and cooldown is satisfied
• Long suggestion on expanding day: close above the upper VWAP band, VWAP slope positive, micro flow positive, session and cooldown satisfied
• Short suggestion on expanding day: close below the lower VWAP band, VWAP slope negative, micro flow negative, session and cooldown satisfied
• Positions flip on opposite suggestions or exit by brackets
What you will see on the chart
• Markers on suggestion bars: L for long, S for short
• Exit occurs on reverse signal or when a bracket order is filled
• Reference lines: daily anchored VWAP with upper and lower bands
• Optional background: teal for balanced day, orange for expanding day
Inputs with guidance
Setup
• Signal length. Residual and regime window. Typical 40 to 100. Higher smooths, lower reacts faster
Micro Flow
• Micro TF. Lower timeframe used for micro flow, default 1 minute
• Micro span bars. Count of lower-TF bars. Typical 5 to 20
• Micro flow gate 0..1. Minimum absolute flow. Raising it demands stronger confirmation and reduces trade count
VWAP Bands
• VWAP stdev multiplier. Band width. Typical 0.8 to 1.6. Wider bands reduce breakout frequency and increase fade distance
• Expansion gate 0..3. Threshold to switch from fades to breakouts. Raising it favors fades, lowering it favors breakouts
Sessions
• Use session filter. Enable to trade only inside your window
• Trade window UTC. Default 07:00 to 17:00
Risk
• ATR length. Stop and target basis. Typical 10 to 21
• Stop ATR x. Initial stop distance in ATR multiples
• Target ATR x. Profit target distance in ATR multiples
• Cooldown bars after close. Wait bars before a new entry
• Side. Both, long only, or short only
View
• Show VWAP and bands
• Color bars by residual regime
Properties visible in this publication
• Initial capital 10000
• Base currency Default
• request.security uses lookahead off everywhere
• Strategy: Percent of equity with value 3. Pyramiding 0. Commission cash per order 0.0001 USD. Slippage 3 ticks. Process orders on close ON. Bar magnifier ON. Recalculate after order is filled OFF. Calc on every tick OFF. Using standard OHLC fills ON.
Realism and responsible publication
No performance claims. Past results never guarantee future outcomes. Fills and slippage vary by venue. Shapes can move while a bar forms and settle on close. Strategies must run on standard candles for signals and orders.
Honest limitations and failure modes
High impact news, session opens, and thin liquidity can invalidate assumptions. Very quiet days can reduce contrast between residuals and price volatility. Session windows use the chart exchange time. If both stop and target are touched within a single bar, TradingView’s standard OHLC price-movement model decides the outcome.
Expect different behavior on illiquid pairs or during holidays. The model is sensitive to session definitions and feed time. Past results never guarantee future outcomes.
Legal
Education and research only. Not investment advice. You are responsible for your decisions. Test on historical data and in simulation before any live use. Use realistic costs.

FVG Ultra Assertive - Individual Filters (mtbr)FVG Ultra Assertive - Individual Filters (mtbr)
What this script offers:
This strategy detects and highlights FVGs (Fair Value Gaps) on the chart, providing traders with a visual and systematic approach to identify potential price inefficiencies. The script plots bullish and bearish FVG zones using customizable boxes and labels, allowing users to easily spot high-probability trading areas. In addition, it opens and closes simulated trades based on the detected FVGs, enabling full backtesting and strategy performance evaluation. It integrates multiple independent filters to validate the strength of each FVG signal before entering a trade.
How it works:
The script identifies:
Bullish FVGs when the current low is higher than the high of two bars ago.
Bearish FVGs when the current high is lower than the low of two bars ago.
Once an FVG is detected, it applies three optional independent filters:
GAP/ATR Filter:
Measures the FVG size relative to the Average True Range (ATR). Only gaps exceeding a user-defined multiple of ATR are considered valid.
Support/Resistance (S/R) Filter:
Uses pivot points to check if the FVG overlaps with recent high/low pivot levels within a tolerance percentage. This ensures the gap aligns with meaningful market levels.
Stochastic Filter:
Applies a stochastic oscillator to confirm momentum. Bullish FVGs are validated when stochastic values are oversold, and bearish FVGs when overbought.
After passing the selected filters, the strategy opens trades:
LONG FVG for bullish signals (buy)
SHORT FVG for bearish signals (sell)
The strategy automatically closes positions when an opposite signal appears, generating a backtest report with trades, profits, and statistics. The final bullish or bearish FVG signals are plotted as colored boxes on the chart with labels “BULL FVG” or “BEAR FVG” for immediate visual reference.
How to configure it for use:
Use GAP/ATR Filter: Enable or disable the ATR-based filter and adjust the ATR period (ATR Length) and minimum gap multiplier (Minimum Gap x ATR).
Use S/R Filter: Enable or disable the pivot-based S/R filter. Configure the pivot lookback periods (Pivot Left and Pivot Right) and the tolerance percentage (Gap Tolerance %).
Use Stochastic Filter: Enable or disable stochastic confirmation. Adjust the K and D lengths (Stoch K Length and Stoch D Length) and the overbought/oversold thresholds (Stoch Overbought and Stoch Oversold).
Colors: Customize the colors for bullish and bearish FVGs (FVG Bull and FVG Bear) to match your chart preferences.
Usage Tips:
Apply this strategy to any timeframe; shorter timeframes generate more frequent FVGs, while higher timeframes highlight stronger gaps.
Combine FVG signals with other technical analysis tools for better trade confirmation.
Use the box and label visualization to quickly scan charts for trade opportunities without cluttering the chart.
The strategy’s trades (LONG and SHORT) provide backtesting results and performance statistics for each signal.

Project Monday Strategy [AlgoAI System]Overview
Project Monday is a sophisticated trading strategy designed for active market participants. This strategy can be used alongside other forms of technical analysis, providing traders with additional tools to enhance their market insights. While it offers a flexible approach for identifying and exploiting market inefficiencies, Project Monday does not fit every market condition and requires adjustments. Its core principles include technical analysis and risk management, all aimed at making informed trading decisions and managing risk effectively.
Features
Project Monday Strategy works in any market and includes many features:
Efficient Trading Presets: Offers ready-to-use presets that allow traders to start efficient trading with one click.
Confirmation Signals: Provides signals to help traders validate trends, emphasizing informed decision-making (not to be followed blindly).
Reversal Signals: Identifies signals to alert traders to potential reversals, encouraging careful analysis (not to be followed blindly).
Adaptability: Can be adjusted to fit different market conditions, ensuring ongoing effectiveness.
Multi-Market Application: Suitable for use across various asset classes including stocks, forex, commodities, and cryptocurrencies.
Integration: Can be used alongside other technical analysis tools for enhanced decision-making.
Position Sizing: Allows traders to determine optimal trade size using backtesting and trading performance dashboard.
Backtesting: Supports historical testing to refine and validate the strategy.
Continuous Monitoring: Includes features for ongoing performance evaluation and strategy adjustments.
Unique Project Monday Strategy Features on TradingView:
Adaptive Position Sizing: Dynamically adjusts the size of each position based on market conditions and predefined risk management criteria, ensuring optimal trade sizing and risk exposure.
Preliminary Position Opening: Allows traders to enter a position in anticipation of a signal confirmation, enabling them to capture early market movements and improve entry points.
Preliminary Position Closing: Enables traders to exit a position before a signal reversal, helping to lock in profits and minimize potential losses during volatile market conditions.
Adjusting Strategy Parameters:
Price Band Inputs:
Project Monday Strategy uses a set of configurable inputs to tailor its behavior according to the trader's preferences. The following are the key inputs for the price band calculations. Signals are not generated when the price remains within these bands.
“Length of Calculation” determines how many historical data points are used in the trend calculation. A shorter “Length of Calculation” will make the Price Band more responsive to recent price changes but may also increase the noise and the likelihood of false signals. A longer “Length of Calculation” will make the Price Band smoother, with less noise, but may cause more lag in reacting to price changes.
“Offset” determines the position of the Gaussian filter, which is used to weight the data points in the trend calculation. The offset is expressed as a fraction of the “Length of Calculation”, with a value between 0 and 1. A higher “Offset” will shift the Gaussian filter closer to the more recent data points, making the Price Band more responsive to recent price changes but potentially increasing noise. A lower “Offset” will shift the Gaussian filter closer to the centre of the window, resulting in a smoother Price Band but potentially introducing more lag.
“Sigma” refers to the standard deviation used in the Gaussian distribution function. This parameter determines the smoothness of the curve and the degree to which data points close to the centre of the “Length of Calculation” are weighted more heavily than those further away. A smaller “Sigma” will result in a narrower Gaussian filter, leading to a more responsive Price Band but with a higher chance of noise and false signals. A larger “Sigma” will result in a wider Gaussian filter, creating a smoother Price Band but with more lag.
Adjust the “Source” inputs to specify which type of price data should be used for strategy calculations and signal generation.
“Width of Band” input determines the multiplier for the band width. A higher value of “Width of Band” makes the price band wider, which generates fewer signals due to the lower probability of the price moving outside the band. Conversely, a lower multiplier makes the band narrower, generating more signals but also increasing the likelihood of false signals.
Direction input:
The Project Monday strategy includes an input to specify the direction of trades, allowing traders to control whether the strategy should consider long positions, short positions, or both. The following input parameter is used for this purpose:
This input parameter allows traders to define the type of positions the strategy will take. It has three options:
Only Long: The strategy will generate signals exclusively for buying or closing short positions, focusing on potential uptrends.
Only Short: The strategy will generate signals exclusively for selling or closing long positions, focusing on potential downtrends.
Both: The strategy will generate signals for both buying (long positions) and selling (short positions), allowing for a more comprehensive trading approach that captures opportunities in both rising and falling markets.
Signals Filter:
The Project Monday strategy includes inputs to filter signals based on higher timeframes and the length of the data used for filtering. These inputs help traders refine the strategy's performance by considering broader market trends and smoothing out short-term fluctuations.
Filter Timeframe input specifies the timeframe used for filtering signals. By choosing a higher timeframe, traders can filter out noise from shorter timeframes and focus on more significant trends. The options range from intraday minutes (e.g., 1, 5, 15 minutes) to daily (1D, 2D, etc.), weekly (1W, 2W, etc.), and monthly (1M) timeframes. This allows traders to align their strategy with their preferred trading horizon and market perspective.
Filter Length input defines the number of data points used for filtering signals on the selected timeframe. A longer filter length will smooth out the data more, helping to identify sustained trends and reduce the impact of short-term fluctuations. Conversely, a shorter filter length will make the filter more responsive to recent price changes, potentially generating more signals but also increasing sensitivity to market noise.
Adaptive Position Size:
The Project Monday strategy incorporates inputs for unique feature Adaptive Position Sizing (APS), which dynamically adjusts the size of trades based on market conditions and specified parameters. This feature helps optimize risk management and trading performance.
Enable Adaptive Position Size: Users can check or uncheck this box to enable or disable the Adaptive Position Size feature. When checked, the strategy dynamically adjusts position sizes based on the defined parameters. This allows traders to scale their positions according to market volatility and other factors, enhancing risk management and potentially improving returns. When unchecked, the strategy will not adjust position sizes adaptively, and positions will remain fixed as per other settings.
“Timeframe for Adaptive Position Size “input specifies the timeframe used for calculating the position size. Options range from intraday minutes (e.g., 30, 60 minutes) to daily (1D, 3D), weekly (1W), and monthly (1M) timeframes. Selecting an appropriate timeframe helps align position sizing calculations with the trader’s overall strategy and market perspective, ensuring that position sizes are adjusted based on relevant market data.
“APS Length” input defines the number of data points used to calculate the adaptive position size. A longer APS length will result in higher position sizes. Conversely, a shorter APS length will result in smaller position sizes.
Anticipatory Trading:
Project Monday Strategy includes inputs for unique feature Anticipatory Trading, allowing traders to open and close positions preliminarily based on certain conditions. This feature aims to provide an edge by taking action before traditional signals confirm.
Enable Preliminary Position Opening: Users can check or uncheck this box to enable or disable Preliminary Position Opening. When enabled, the strategy will open positions based on preliminary conditions before the standard signals are confirmed. This can help traders capitalize on early trend movements and potentially gain a better entry point.
Enable Preliminary Position Closing: Users can check or uncheck this box to enable or disable Preliminary Position Closing. When enabled, the strategy will close positions based on preliminary conditions before the standard exit signals are confirmed. This can help traders lock in profits or limit losses by exiting positions at the early signs of trend reversals.
“Position Size in %” input specifies the position size as a percentage of the trading capital. By setting this value, traders can control the amount of capital allocated to each trade. For example, a risk value of 40% means that 40% of the available trading capital will be used for each anticipatory trade. This helps in managing risk and ensuring that the position size aligns with the trader's risk tolerance and overall strategy.
Usage:
Signal Generation
Long signal indicates a potential uptrend, suggesting either buying or closing a short position. Short signal indicates a potential downtrend, suggesting either selling or closing a long position. Signals are generated on your chart when the price moves beyond a calculated price band based on the current trend.
Signal Filtering
The strategy includes a filtering mechanism based on the current or another timeframe. Filtering works best with higher timeframes. This component calculates the trend on a higher timeframe and predicts the trend, ensuring trades on the current timeframe are only opened if they align with the higher timeframe trend. Setting the right filter timeframe is crucial for obtaining the best signals.
Position Direction
Users can choose the direction of positions to open via the settings box. Options include only long positions, only short positions, or both.
Adaptive Position Size (APS)
Users can enable the Adaptive Position Size feature to adjust position sizes based on trend strength. The strategy evaluates the strength of the current trend based on a higher timeframe. The stronger the trend, the larger the position size for opening a position.
Anticipatory Trading
Users can activate this unique feature to enhance trading decisions. The strategy assesses the likelihood of receiving a main signal. If the opportunity appears strong, it opens a partial position, as specified in the settings box. As the probability of the signal strengthens, the strategy gradually increases the position size.
Exit Strategy
The strategy exits positions based on receiving a reverse signal. Positions opened through “Anticipatory trading” are exited incrementally as each preliminary signal reverses.
By following these steps, traders can implement the strategy to navigate various market scenarios, manage risk, and adjust trading performance over time. Adjusting parameters and monitoring signals diligently are key to adapting the strategy to individual trading styles and market conditions.
You will get
By purchasing the Project Monday strategy, you not only gain access to a cutting-edge system but also receive ready-to-use presets designed to help you start trading immediately and achieve optimal results. Additionally, you benefit from comprehensive support and the option to request custom presets for your desired financial instruments through our dedicated support team, ensuring you have the tools and assistance needed for successful trading.
Risk Disclaimer
This information is not a personalized investment recommendation, and the financial instruments or transactions mentioned in it may not be appropriate for your financial situation, investment objective(s), risk tolerance, and/or expected return. AlgoAI shall not be liable for any losses incurred in the event of transactions or investments in financial instruments mentioned in this information.

Macro Score - Dem. Fib. McGinley DynamicsA "macro score", as defined here, is created by giving various weights to different signals and adding them together to get one smooth score. Positive or negative values are assigned to each of the signals depending on if the statement is true or false (e.g. DPO > 0: +1, DPO < 0: -1). This manner of strategy allows for a subset of the available signals to be present at one time as opposed to every technical signal having to be active in order for a long/short signal to trigger.
The DFMG - Democratic Fibonacci McGinley Dynamic - is a separate indicator that we have released that takes 10 different Fibonacci McGinley Dynamics (lengths of 3 to 233, at Fibonacci intervals) and averages them to form the DFMG line. This helps by creating a consensus on the trend based on these dynamic lines alone. Crossovers of the DFMG with the various McGinley lengths as well as a cross of the price source and these lines can provide adequate long and short signals.
This strategy has the signals and weights pre-determined in the code. Heaviest weights have been given to crosses of the DFMG line/McGinley(233) as well as the crosses of the McGinley(3)/DFMG. Additionally, there are thresholds for DPO ( Detrended Price Oscillator , above or below 0), CMO ( Chande Momentum Oscillator , above or below 0), Jurik Volatility Bands (above or below 0), and Stoch RSI (above or below 50). These four signals hold a lighter weight than the McGinley cross signals.
The macro score itself is printed in an underlay as a white line that goes between -10 and 10 for this strategy. In addition to the macro score line, a green momentum line (sourced by the macro score itself) has been included. A crossover/crossunder of the macro score and the macro momentum line is included into the long/short signal syntax in addition to long and short thresholds for the macro score, defaulted to 5 and -5 respectively.
Take profit, stop loss, and trailing percentages are also included, found at the bottom of the Input tab under “TT and TTP” as well as “Stop Loss”. Make sure to understand the TP/SL ratio that you desire before use, as the desired hit rate/profitability percentage will be affected accordingly. The option for adding in a trailing stop has also been included, with options to choose between an ATR-based trail or a percentage-based trail.
This strategy does NOT guarantee future returns. Apply caution in trading regardless of discretionary or algorithmic. Understand the concepts of risk/reward and the intricacies of each strategy choice before utilizing them in your personal trading.
Profitview/Pineconnector Settings:
If you wish to utilize Profitview’s automation system, find the included “Profitview Settings” under the Input tab of the strategy settings menu. If not, skip this section entirely as it can be left blank. Options will be “OPEN LONG TITLE”, “OPEN SHORT TITLE”, “CLOSE LONG TITLE”, and “CLOSE SHORT TITLE”. If you wished to trade SOL, for example, you would put “SOL LONG”, “SOL SHORT”, “SOL CLOSE LONG”, and “SOL CLOSE SHORT” in these areas. Within your Profitview extension, ensure that your Alerts all match these titles. To set an alert for use with Profitview, go to the “Alerts” tab in TradingView, then create an alert. Make sure that your desired asset and timeframe are currently displayed on your screen when creating the alert. Under the “Condition” option of the alert, select the strategy, then select the expiration time. If using TradingView Premium, this can be open-ended. Otherwise, select your desired expiration time and date. This can be updated whenever desired to ensure the strategy does not expire. Under “Alert actions”, nothing necessarily needs to be selected unless so desired. Leave the “Alert name” option empty. For the “Message”, delete the generated message and replace it with {{strategy.order.alert_message}} and nothing else. If using Pineconnector, follow the same directions for setting up an alert, but use the " ,buy, ,risk=" syntax as noted in the tooltips.
Default Properties for AVAX 20M:
DPO - 35 , uncentered
CMO - 25, open
K/D - 3/3
RSI Stoch Length - 3
Stoch Length - 4
Stoch Source - open
JVB Length - 14
JVB Smoothing - 2
DFMG source - close
Macro Length - 14
TP % - 1.5%
TTP % - 0.005%
SL % - 1.8%, no trail

Macro Score - DFMA-BasedA "macro score", as defined here, is created by giving various weights to different signals and adding them together to get one smooth score. Positive or negative values are assigned to each of the signals depending on if the statement is true or false (e.g. DPO > 0: +1, DPO < 0: -1). This manner of strategy allows for a subset of the available signals to be present at one time as opposed to every technical signal having to be active in order for a long/short signal to trigger.
The DFMA - Democratic Fibonacci Moving Average - is a separate indicator that we have released that takes 10 different Fibonacci MAs (lengths of 3 to 233, at Fibonacci intervals) and averages them to form the DFMA line. This helps by creating a consensus on the trend based on moving averages alone. Crossovers of the DFMA with the various Fib MA lengths as well as a cross of the price source and these lines can provide adequate long and short signals.
This strategy has the signals and weights pre-determined in the code. Heaviest weights have been given to crosses of the DFMA line/Fib MA (233) as well as the crosses of the Fib MA (3)/DFMA. Additionally, there are thresholds for DPO ( Detrended Price Oscillator , above or below 0), CMO ( Chande Momentum Oscillator , above or below 0), Jurik Volatility Bands (above or below 0), and Stoch RSI (above or below 50). These foursignals hold a lighter weight than the MA cross signals.
The macro score itself is printed in an underlay as a white line that goes between -10 and 10 for this strategy. In addition to the macro score line, a blue momentum line (sourced by the macro score itself) has been included. A crossover/crossunder of the macro score and the macro momentum line is included into the long/short signal syntax in addition to a threshold for the macro score (-5/5).
Take profit, stop loss, and trailing percentages are also included, found at the bottom of the Input tab under “TT and TTP” as well as “Stop Loss”. Make sure to understand the TP/SL ratio that you desire before use, as the desired hit rate/profitability percentage will be affected accordingly. This strategy does NOT guarantee future returns. Apply caution in trading regardless of discretionary or algorithmic. Understand the concepts of risk/reward and the intricacies of each strategy choice before utilizing them in your personal trading.
Profitview Settings:
If you wish to utilize Profitview’s automation system, find the included “Profitview Settings” under the Input tab of the strategy settings menu. If not, skip this section entirely as it can be left blank. Options will be “OPEN LONG TITLE”, “OPEN SHORT TITLE”, “CLOSE LONG TITLE”, and “CLOSE SHORT TITLE”. If you wished to trade SOL, for example, you would put “SOL LONG”, “SOL SHORT”, “SOL CLOSE LONG”, and “SOL CLOSE SHORT” in these areas. Within your Profitview extension, ensure that your Alerts all match these titles. To set an alert for use with Profitview, go to the “Alerts” tab in TradingView, then create an alert. Make sure that your desired asset and timeframe are currently displayed on your screen when creating the alert. Under the “Condition” option of the alert, select the strategy, then select the expiration time. If using TradingView Premium, this can be open-ended. Otherwise, select your desired expiration time and date. This can be updated whenever desired to ensure the strategy does not expire. Under “Alert actions”, nothing necessarily needs to be selected unless so desired. Leave the “Alert name” option empty. For the “Message”, delete the generated message and replace it with {{strategy.order.alert_message}} and nothing else.
Default Properties, for AVAX 20M:
DPO - 40, uncentered
CMO - 25, open
K/D - 3/3
RSI Stoch Length - 3
Stoch Length - 4
Stoch Source - open
JVB Length - 25
JVB Smoothing - 2
DFMA source - close
Macro Length - 13
TP % - 1.5%
TTP % - 0.005%
SL % - 2%

MACD + RSI + ADX Strategy (ChatGPT-powered) by TradeSmartThis is a trading strategy made by TradeSmart, using the recommendations given by ChatGPT . As an experiment, we asked ChatGPT on which indicators are the most popular for trading. We used all of the recommendations given, and added more. We ended up with a strategy that performs surprisingly well on many crypto and forex assets. See below for exact details on what logic was implemented and how you can change the parameters of the strategy.
The strategy is a Christmas special , this is how we would like to thank the support of our followers.
The strategy has performed well on Forex, tested on 43 1-hour pairs and turned a profit in 21 cases. Also it has been tested on 51 crypto pairs using the 1-hour timeframe, and turned a profit in 45 cases with a Profit Factor over 1.4 in the top-5 cases. Tests were conducted without commission or slippage, unlike the presented result which uses 0.01% commission and 5 tick slippage.
Some of the top performers were:
SNXUSDT
SOLUSDT
CAKEUSDT
LINKUSDT
EGLDUSDT
GBPJPY
TRYJPY
USDJPY
The strategy was implemented using the following logic:
Entry strategy:
Long entry:
Price should be above the Simple Moving Average (SMA)
There should be a cross up on the MACD (indicated by the color switch on the histogram, red to green)
RSI should be above the 50 level
Volume is above the selected volume-based Exponential Moving Average (EMA)
ADX should also agree to this position: below 50 and over 20, and above the Regularized Moving Average (REMA)
Short entry:
Price should be under the Simple Moving Average (SMA)
There should be a cross down on the MACD (indicated by the color switch on the histogram, red to green)
RSI should be below the 50 level
Volume is above the selected volume-based Exponential Moving Average (EMA)
ADX should also agree to this position: below 50 and over 20, and above the Regularized Moving Average (REMA)
Exit strategy:
Stop Loss will be placed based on ATR value (with 1.5 Risk)
Take profit level will be placed with a 2.5 Risk/Reward Ratio
Open positions will be closed early based on the Squeeze Momentum (Long: change to red, Short: change to green)
NOTE! : The position sizes used in the example is with 'Risk Percentage (current)', according which the position size will be determined such
that the potential loss is equal to % of the current available capital. This means that in most of the cases, the positions are calculated using leverage.
Parameters of every indicator used in the strategy can be tuned in the strategy settings as follows:
Plot settings:
Plot Signals: true by default, Show all Long and Short signals on the signal candle
Allow early TP/SL plots: false by default, Checking this option will result in the TP and SL lines to be plotted also on the signal candle rather than just the entry candle. Consider this only when manual trading, since backtest entries does not happen on the signal candle.
Entry Signal:
Fast Length: 12 by default
Slow Length: 26 by default
Source: hlcc4 by default
Signal Smoothing: 9 by default
Oscillator MA Type: EMA by default
Signal Line MA Type: EMA by default
Exit Strategy:
ATR Based Stop Loss: true by default
ATR Length (of the SL): 14 by default
ATR Smoothing (of the SL): EMA by default
Candle Low/High Based Stop Loss: false by default, recent lowest or highest point (depending on long/short position) will be used to calculate stop loss value. Set 'Base Risk Multiplier' to 1 if you would like to use the calculated value as is. Setting it to a different value will count as an additional multiplier. Please select only one active stop loss. Default value (if nothing or multiple stop losses are selected) is the 'ATR Based Stop Loss'.
Candle Lookback (of the SL): 10 by default
Base Risk Multiplier: 1.5 by default, the stop loss will be placed at this risk level (meaning in case of ATR SL that the ATR value will be multiplied by this factor and the SL will be placed that value away from the entry level)
Risk to Reward Ratio: 2.5 by default, the take profit level will be placed such as this Risk/Reward ratio is met
Force Exit based on Squeeze Momentum: true by default, a Long position will be closed when Squeeze Momentum turns red inside an open position and a Short position will be closed when Squeeze Momentum turns green inside an open position
BB Length: 20 by default
BB Mult Factor: 1.0 by default
KC Length: 20 by default
KC Mult Factor: 1.5 by default
Use True Range (KC): Yes by default
Base Setups:
Allow Long Entries: true by default
Allow Short Entries: true by default
Order Size: 1.5 by default
Order Type: Risk Percentage (current) by default, allows adjustment on how the position size is calculated: Cash: only the set cash ammount will be used for each trade Contract(s): the adjusted number of contracts will be used for each trade Capital Percentage: a % of the current available capital will be used for each trade Risk Percentage (current): position size will be determined such that the potential loss is equal to % of the current available capital Risk Percentage (initial): position size will be determined such that the potential loss is equal to % of the initial capital
Trend Filter:
Use long trend filter: true by default, only enter long if price is above Long MA
Show long trend filter: true by default, plot the selected MA on the chart
MA Type (Long): SMA by default
MA Length (Long): 100 by default
MA Source (Long): close by default
Use short trend filter: true by default, only enter long if price is under Short MA
Show short trend filter: false by default, plot the selected MA on the chart
MA Type (Short): SMA by default
MA Length (Short): 100 by default
MA Source (Short): close by default
Simple RSI Limiter:
Limit using Simple RSI: true by default, if set to 'Normal', only enter long when Simple RSI is lower then Long Boundary, and only enter short when Simple RSI is higher then Short Boundary. If set to 'Reverse', only enter long when Simple RSI is higher then Long Boundary, and only enter short when Simple RSI is lower then Short Boundary.
Simple RSI Limiter Type:
RSI Length: 14 by default
RSI Source: hl2 by default
Simple RSI Long Boundary: 50 by default
Simple RSI Short Boundary: 50 by default
ADX Limiter:
Use ADX Limiter: true by default, only enter into any position (long/short) if ADX value is higher than the Low Boundary and lower than the High Boundary.
ADX Length: 5 by default
DI Length: 5 by default
High Boundary: 50 by default
Low Boundary: 20 by default
Use MA based calculation: Yes by default, if 'Yes', only enter into position (long/short) if ADX value is higher than MA (ADX as source).
MA Type: REMA by default
MA Length: 5 by default
Volume Filter:
Only enter trades where volume is higher then the volume-based MA: true by default, a set type of MA will be calculated with the volume as source, and set length
MA Type: EMA by default
MA Length: 10 by default
Session Limiter:
Show session plots: false by default, show crypto market sessions on chart: Sidney (red), Tokyo (orange), London (yellow), New York (green)
Use session limiter: false by default, if enabled, trades will only happen in the ticked sessions below.
Sidney session: false by default, session between: 15:00 - 00:00 (EST)
Tokyo session: false by default, session between: 19:00 - 04:00 (EST)
London session: false by default, session between: 03:00 - 11:00 (EST)
New York session: false by default, session between: 08:00 - 17:00 (EST)
Date Range:
Limit Between Dates: false by default
Start Date: Jul 01 2021 00:00:00 by default
End Date: Dec 31 2022 00:00:00 by default
Trading Time:
Limit Trading Time: false by default, tick this together with the options below to enable limiting based on day and time
Valid Trading Days Global: 1234567 by default, if the Limit Trading Time is on, trades will only happen on days that are present in this field. If any of the not global Valid Trading Days is used, this field will be neglected. Values represent days: Sunday (1), Monday (2), ..., Friday (6), Saturday(7) To trade on all days use: 123457
(1) Valid Trading Days: false, 1234567 by default, values represent days: Sunday (1), Monday (2), ..., Friday (6), Saturday(7) The script will trade on days that are present in this field. Please make sure that this field and also (1) Valid Trading Hours Between is checked
(1) Valid Trading Hours Between: false, 0930-1600 by default, hours between which the trades can happen. The time is always in the exchange's timezone
Fine-tuning is highly recommended when using other asset/timeframe combinations.

Macro Score -- User-Customized Scores and SignalsA "macro score", as defined here, is created by giving various weights to different signals and adding them together to get one smooth score. Positive or negative values are assigned to each of the signals depending on if the statement is true or false (e.g. DPO > 0: +1, DPO < 0: -1). This manner of strategy allows for a subset of the available signals to be present at one time as opposed to every technical signal having to be active in order for a long/short signal to trigger. This particular strategy allows the user to choose between 18 different signals to be used in scoring as well as allowing the user to determine the individual weights of each score as well as the overall threshold to determine long or short signals. Weights for each score range between 1 and 5, with 5 being the greatest weight. The overall threshold for long or short is dependent on the total possible weights added together (i.e. if your weights total -10 or +10, a threshold within this range must be used).
The macro score itself is printed in an underlay as a white line that goes between the maximum positive and negative values for all weights added together for this strategy. In addition to the macro score line, a green momentum line (sourced by the macro score itself) has been included. A crossover/crossunder of the macro score and the macro momentum line is included into the long/short signal syntax in addition to a threshold for the macro score. The length of the Macro Score's momentum line can be found in the settings.
The current signals to choose from include:
- ADX Threshold - if the Average Directional Index is above a set threshold, signal positive or negative
- CMF Threshold - if the Chaikin Money Flow oscillator is above 0, signal positive; otherwise, signal negative
- CMO > TSI Signal - signal positive if there is a cross of the Chande Momentum Oscillator and the True Strength Index signal line
- CMO Threshold - if the Chande Momentum Oscillator is above 0, signal positive; otherwise, signal negative
- DPO Threshold - if the Detrended Price Oscillator is above 0, signal positive; otherwise, signal negative
- EOM Threshold - if the Ease of Money Oscillator is above 0, signal positive; otherwise, signal negative
- Jurik Threshold - if the Jurik price line (from the Jurik Volatility Bands) is above 0, signal positive; otherwise, signal negative
- MACD Threshold - if the MACD signal line is above 0, signal positive; otherwise, signal negative
- McGinley Cross - a crossover of a fast McGinley Dynamic length line and a slow McGinley Dynamic line signals positive; otherwise, signal negative
- PSAR - if the direction of the PSAR is heading long, signal positive; otherwise, signal negative
- ROC Threshold - if the Rate of Change oscillator is above 0, signal positive; otherwise, signal negative
- RSI Threshold - if the Relative Strength Index is above 50, signal positive; otherwise, signal negative
- Stoch RSI Threshold - if the Stoch RSI is above 50, signal positive; otherwise, signal negative
- Supertrend - if the Supertrend determines long, signal positive; otherwise, signal negative
- TSI Cross - a crossover of the True Strength Index value line and the TSI signal line signals positive; otherwise, signal negative
- TSI Signal Threshold - if the TSI signal line is above 0, signal positive; otherwise, signal negative
- Williams Alligator Cross - if the Williams Alligator lips cross the teeth and jaw, signal positive; otherwise, signal negative
- Williams %R - if the Williams %R is above -50, signal positive; otherwise, signal negative
Take profit, stop loss, and trailing percentages are also included, found at the bottom of the Input tab under “TT and TTP” as well as “Stop Loss”. Make sure to understand the TP/SL ratio that you desire before use, as the desired hit rate/profitability percentage will be affected accordingly. This strategy does NOT guarantee future returns. Apply caution in trading regardless of discretionary or algorithmic. Understand the concepts of risk/reward and the intricacies of each strategy choice before utilizing them in your personal trading.
Profitview Settings:
If you wish to utilize Profitview’s automation system, find the included “Profitview Settings” under the Input tab of the strategy settings menu. If not, skip this section entirely as it can be left blank. Options will be “OPEN LONG TITLE”, “OPEN SHORT TITLE”, “CLOSE LONG TITLE”, and “CLOSE SHORT TITLE”. If you wished to trade SOL, for example, you would put “SOL LONG”, “SOL SHORT”, “SOL CLOSE LONG”, and “SOL CLOSE SHORT” in these areas. Within your Profitview extension, ensure that your Alerts all match these titles. To set an alert for use with Profitview, go to the “Alerts” tab in TradingView, then create an alert. Make sure that your desired asset and timeframe are currently displayed on your screen when creating the alert. Under the “Condition” option of the alert, select the strategy, then select the expiration time. If using TradingView Premium, this can be open-ended. Otherwise, select your desired expiration time and date. This can be updated whenever desired to ensure the strategy does not expire. Under “Alert actions”, nothing necessarily needs to be selected unless so desired. Leave the “Alert name” option empty. For the “Message”, delete the generated message and replace it with {{strategy.order.alert_message}} and nothing else.
Sample setup for SOLUSDT 30M:
- Score 1 - Value 4, PSAR (0.05 start, 0.02 increment, 0.2 max value; sourced open)
- Score 2 - Value 4, Jurik Threshold (JVB Length 25, JVB Smoothing 6, JVB Price Threshold 0)
- Score 3 - Value 5, DPO Threshold (DPO Length 40, uncentered)
- Score 4 - Value 5, CMO Threshold (CMO Length 40, sourced open)
- Score 5 - Value 2, MACD Threshold (Fast Length 12, Slow Length 30, sourced open)
- Macro Length 21
- Long Threshold - -3
- Short Threshold - +3
- Take Profit % - 0.9/0.9
- Trail % - 0.005
- Stop Loss % - 1.4
Sample setup for AVAXUSDT 20M:
- Score 1 - Value 3, TSI Cross (Long Length 25, Short Length 16, Signal Length 17)
- Score 2 - Value 2, TSI Signal Threshold (same settings as the TSI Cross)
- Score 3 - Value 2, Jurik Threshold (JVB Length 20, JVB Smoothing 8, JVB Price Threshold 0)
- Score 4 - Value 2, DPO Threshold (DPO Length 40, uncentered)
- Score 5 - Value 1, Stoch Threshold (K/D 3, RSI (Stoch) Length 10, Stochastic Length 4, sourced open)
- Macro Length 13
- Long Threshold - +5
- Short Threshold - -5
- Take Profit % - 1.2/1.2
- Trail % - 0.005
- Stop Loss % - 1.5

Rob Booker Reversal Tabs StrategyRob Booker Reversal Tabs Strategy is an updated version of Rob Bookers Reversal Tab study: Rob Booker Reversal Tabs
While the original is a Pinescript study, this version can be switched between strategy and indicator mode.
Rob Bookers script generates reversal signal based on MACD and Stochastics, it is not a true reversal system, default pyramiding value is set to 5.
Inputs determine MACD and Stochastics settings. The only additional input is the "Strategy Mode" checkbox.
This script works well on its own for some tickers, but like any reversal pattern generating scripts, traders will profit from looking at overall price action and trend strength before making a trade.
From the original:
A simple reversal pattern indicator that uses MACD and Stochastics.
Created by Rob Booker and programmed by Andrew Palladino.
Please note that I only updated the original to V5 and edited it to be a strategy, which was a grand total of 5 minutes of work. I updated it because I wanted to see how the script performs as a strategy and I'm publishing it in case others would like to use it. I take no credit whatsoever for the original and WILL take this version down if Rob Booker or his Team ask me to or decide to release their own strategy version of the original.
Check out Rob Bookers scripts and ideas on his Tradingview account: robbooker

rt maax EMA cross strategythis just sample of our strategies we published with open source, to learning our investor the way of trading and analysis, this strategy just for study and learning
in this strategy we use expontial moving avarage 20 , 50 , 200 and the we build this strategy when the price move up ema 200 and ema 20,50 cross up the 200 ema in this conditions the strargey will open long postion
and the oppisit it is true for short postion in this sitation the price should be under ema 200 and the ema 20 , 50 should cross under 200 ema then the strategy will open the short postion
we try this strategy on forex ,crypto and futures and it give us very good result ,, also we try this postion on multi time frame we find the stragey give us good result on 1 hour time frame .
in the end our advice for you before you use any stratgy you should have the knowledg of the indecators how it is work and also you should have information about the market you trade and the last news for this market beacuse it effect so much on the price moving .
so we hope this strategy give you brefing of the way we work and build our strategy

Ultra Moving Average Rating Trend StrategyThis is a technical analysis strategy based initially on the rating strategy, but fully adapted and converted to moving average rating.
In this case we are using: Ichimoku, SMA, EMA, ALMA, SMMA, LSMA, VWMA, DEMA, HMA, KAMA FRAMA, VIDYA, JMA, TEMA, ZLEMA, TRIMA and T3 moving averages.
With all of them together I am making an index.
Rules for entry and exit:
If % percentage of all the moving averages is telling to go long , we go long or exit short. And viceversa for short.
If there are any questions, please let me know !

Forex Midpoint Stratejisi For Nasdaq English Knowledge:
Midpoint Strategy;
The general calculation method is a strategy that helps determine direction by the intersection of a MA line and the value obtained by dividing the lowest and highest price in the specified length range.
Başlangıç Periyodu: The data length of the Midpoint Line.
Kaydırma Seviyesi: The number of steps forward or backward of the Midpoint Line.
Yüzde Seviyesi: the amount of vertical scrolling.
Uzunluk: The length of the MA line
represents.
This strategy is prepared for the Nasdaq 5-minute period. It needs to be optimized for use on other instruments.
There are take profit and stop loss levels within the codes. Friends who want to use it can remove the invisibility from the relevant sections. Also, I removed the midpoint and the MA line so that it does not crowd the image, you can add it if you want.
Thank you.
Turkish Knowledge:
Midpoint Stratejisi;
Genel hesaplama yöntemi, belirlenen uzunluk aralığındaki en düşük ve en yüksek fiyatın ikiye bölümü ile elde edilen değer ve bir ortalama çizgisinin kesişimleriyle yön belirlemeye yardımcı bir stratejidir.
Başlangıç Period: Midpoint Çizgisinin veri uzunluğunu.
Kaydırma Seviyesi: Midpoint Çizgisinin ileri veya geri adım sayısını.
Yüzde Seviyesi: dikey kaydırma miktarını.
Uzunluk: Ortalama çizgisinin uzunluğunu
temsil etmektedir.
Bu strateji Nasdaq 5 dakikalık periot için hazırlanmıştır. Diğer enstrümanlarda kullanılması için optimize edilmesi gerekir.
Kodların içinde Kar alma , zarar durdurma seviyeleri mevcuttur. Kullanmak isteyen arkadaşlar ilgili bölümlerden görünmezliği kaldırabilirler. ayrıca midpoint ve ortalama çizgisinide görüntü kalabalığı yapmaması için ben kaldırdım isterseniz siz ekleyebilirsiniz.
Teşekkürler.

Triple RSI strategyThis strategy is commonly used both in forex and stock markets for reversal trading. when the rsi line reaches and crosses simultaneously at 3 rsi setups i.e at 7, 14, and 21, a signal is generated.
This strategy works best in 1-hour timeframe. It provides over 60 to 80 percent accuracy in 1-hour timeframe.
In the stock market, this strategy provides an excellent entry point, if one is seeking small profits.
One can expect to make around 10 to 50 pips in the forex market easily. However, I advise seeking support from price action from the lower timeframe in the forex market.
I hope you like it.
Follow for more strategies and scripts like this.

Rob Booker - ADX Breakout updated to pinescript V5Rob Booker - ADX Breakout. The strategy remains unchanged but the code has been updated to pinescript V5. This enables compatibility with all new Tradingview features. Additonally, indicators have been made more easily visible, default cash settings as well as input descriptions have been added.
Rob Booker - ADX Breakout: (Directly taken from the official Tradingview V1 version of the script)
Definition
Rob Booker’s Average Directional Index (ADX) Breakout is a trend strength indicator that affirms the belief that trading in the direction of a trend and continuing to follow its pull is more profitable for traders, while simultaneously reducing risk.
History
ADX was traditionally used and developed to determine a price’s trend strength. It is commonly known as a tool from the arsenal of Rob Booker, experienced entrepreneur and currency trader.
Calculations
Calculations for the ADX Breakout indicator are based on a moving average of price range expansion over a specific period of time. By default, the setting rests at 14 bars, this however is not mandatory, as other periods are routinely used for analysis as well.
Takeaways
The ADX line is used to measure and determine the strength of a trend, and so the direction of this line and its interpretation are crucial in a trader’s analysis. As the ADX line rises, a trend increases in strength and price moves in the trend’s direction. Similarly, if the ADX line is falling, a trend decreases in strength and price then enters a period of consolidation, or retracement.
Traditionally, the ADX is plotted on the chart as a single line that consists of values that range from 0-100. The line is non-directional, meaning that it always measures trend strength regardless of the position of a price’s trend (up or down). Essentially, ADX quantifies trend strength by presenting in both uptrends and downtrends of the line.
What to look for
The values associated with the ADX line help traders determine the most profitable trades and where risk lies in the current trend. It is important to know how to quantify trend strength and distinguish between the varying values in order to understand the differences in trending vs. non-trending conditions. Let’s take a look at ADX values and what they mean for trend strength.
ADX Value:
0-25: Signifies an absent of weak trend
25-50: Signifies a strong trend
50-75: Signifies a very strong trend
75-100: Signifies an extremely strong trend
To delve into this a bit further, let’s assess the meaning of ADX if it is valued below 25. If the ADX line remains below 25 for more than 30 or so bars, price then enters range conditions, making price patterns more distinguishable and visible to traders. Price will move up and down between resistance and support in order to determine selling and buying interest and may then eventually break out into a trend or pattern.
The way in which ADX peaks, ebs, and flows is also a signifier of its overall pattern and trend momentum. The line can clearly indicate to the trader when trend strength is strong versus when it is weak. When ADX peaks are pictured as higher, it points towards an increase in trend momentum. If ADX peaks are pictured as lower - you guessed it - it points towards a decrease in trend momentum. A trend of lower ADX peaks could be a warning for traders to watch prices and manage and assess risk before a trade gets out of hand. Similarly, whenever there is a sudden move that seems out of place or a change in trend character that goes against what you’ve seen before, this should be a clear sign to watch prices and assess risk.
Summary
The ADX Breakout indicator is a trend strength indicator that analyzes price movements relative to trend strength to signal a user when is best for a trade and when is best to manage risk and assess patterns. As long as a trader recognizes strong trends and assesses the risk of each trade properly, they should have no problem using this indicator and utilizing it to work in their favor. In addition, the ADX helps identify trending conditions, but while doing so, also aids traders in finding strong trends to trade. The indicator can even alert traders to specific changes in trend momentum, allowing them to be primed for risk management.

Magic BOXThe Magic BOX strategy is designed to work with cryptocurrency and Forex.
Working timeframe from 1 minute to 1 hour.
The strategy is based on the formation of a trade zone. Probably everyone has already noticed that every day there is a period of time that sets a certain corridor for further price movement in order to get out of it up or down. In the Magic BOX strategy, you yourself set the period that gives the best result using only 2 parameters - "Start hour" and "Final hour".
Every day, the algorithm generates a zone at a selected time and then opens deals to break through the upper or lower level of the resulting trading zone.
In addition, the settings have the ability to show additional entries - these are the moments of price rollback to the middle of the zone, as well as repeated breakouts of levels after the completion of the previous transaction.
-------------------------------------
💹 SETUP SETUP:
-------------------------------------
To configure, you should change the values "Start hour" and "Final hour" - the hour of the beginning and the hour of the end of the formation of the trading zone.
By default, the parameters are 20 hours and 7 hours (the time corresponds to the time zone of the exchange!).
To enable additional re-breakout signals, use - "Additional deals (repeat in the zone)"
To enable additional signals for position averaging use - "Additional deals (averaging position)"
-------------------------------------
🟢 TAKE SETUP:
-------------------------------------
The strategy has 3 types of take: BOX, FIX and DAY_CLOSE
BOX - take as a percentage of the width of the formed zone.
FIX - take as a percentage of the asset price.
DAY_CLOSE - select the hour at the beginning of which we close the position forcibly.
-------------------------------------
⛔️ STOP SETUP:
-------------------------------------
The strategy has 3 types of stop line: BOX, FIX and DAY_CLOSE
BOX - stop as a percentage of the width of the formed zone.
FIX - stop as a percentage of the asset price.
DAY_CLOSE - select the hour at the beginning of which we close the position forcibly.
-------------------------------------
💡 OTHER USEFUL FEATURES
-------------------------------------
✅ The screen has a compact display of a table with strategy settings and current level values.
For the convenience of saving your settings, use the standard PrintScreen function.
✅ 👉 In the strategy settings, each field has hints, to do this, hover over the ⓘ sign
-------------------------------------
Magic BOX strategy is closed! You can get test access to it for 48 hours.
👉 In order to gain access or ask questions, write to me in private messages or at the contacts indicated in my signature.
-------------------------------------
-------------------------------------
Magic BOX strategy is closed! You can get test access to it for 48 hours.
👉 In order to gain access or ask questions, write to me in private messages or at the contacts indicated in my signature.
-------------------------------------
========================================================================================================
Стратегия Magic BOX предназначена для работы с криптовалютой и Форексом.
Рабочий таймфрейм от 1 минуты до 1 часа.
В основе стратегии лежит формирование зоны проторговки. Наверное уже каждый заметил, что каждый день есть период времени, который задаёт некий коридор для дальнейшего движения цены с целью выйти из него вверх или вниз. В стратегии Magic BOX Вы сами задаёте тот период, который даёт наилучший результат с помощью всего 2-х параметров - "Start hour" и "Final hour".
Каждый день алгоритм формирует зону в выбранное время и далее открывает сделки на пробой верхнего или нижнего уровня полученной зоны проторговки.
Кроме этого в настройках есть возможность показать дополнительные входы - это моменты отката цены к середине зоны, а также повторные пробития уровней, после завершения предыдущей сделки.
-------------------------------------
💹 НАСТРОЙКА СЕТАПА:
-------------------------------------
Для настройки следует изменять значения "Start hour" и "Final hour" - час начала и час окончания формирования зоны проторговки.
По умолчанию стоят параметры 20 часов и 7 часов (время соответствует времени часовой зоны биржи!).
Для включения дополнительных сигналов повторных пробоев используйте - "Additional deals (repeat in the zone)"
Для включения дополнительных сигналов на усреднение позиции используйте - "Additional deals (averaging position)"
-------------------------------------
🟢 НАСТРОЙКА ТЕЙКОВ:
-------------------------------------
Стратегия имеет 3 типа тейка: BOX, FIX и DAY_CLOSE
BOX - тейк в процентах от ширины сформированной зоны.
FIX - тейк в процентах от цены актива.
DAY_CLOSE - выбираем час, в начале которого принудительно закрываем позицию.
-------------------------------------
⛔️ НАСТРОЙКА СТОПА:
-------------------------------------
Стратегия имеет 3 типа стоп-линии: BOX, FIX и DAY_CLOSE
BOX - стоп в процентах от ширины сформированной зоны.
FIX - стоп в процентах от цены актива.
DAY_CLOSE - выбираем час, в начале которого принудительно закрываем позицию.
-------------------------------------
💡 ПРОЧИЕ ПОЛЕЗНЫЕ ФУНКЦИИ
-------------------------------------
✅ На экране есть компактное отображение таблицы с настройками стратегии и текущими значениями уровней.
Для удобства сохранения своих настроек - воспользуйтесь стандартной функцией PrintScreen.
✅ 👉 В настройках стратегии у каждого поля есть подсказки, для этого наведите курсор на знак ⓘ
-------------------------------------
Стратегия Magic BOX является закрытой! Вы можете получить к ней тестовый доступ на 48 часов.
👉 Для того, чтобы получить доступ или задать вопросы пишите мне в личные сообщения или по контактам, указанным в моей подписи.
-------------------------------------

Stochastic Moving AverageHi all,
This Strategy script combines the power of EMAs along with the Stochastic Oscillator in a trend following / continuation manner, along with some cool functionalities.
I designed this script especially for trading altcoins, but it works just as good on Bitcoin itself and on some Forex pairs.
______ SIGNALS ______
The script has 4 mandatory conditions to unlock a trading signal. Find these conditions for a long trade below (works the exact other way round for shorts)
- Fast EMA must be higher than Slow EMA
- Stochastic K% line must be in oversold territory
- Stochastic K% line must cross over Stochastic D% line
- Price as to close between slow EMA and fast EMA
Once all the conditions are true, a trade will start at the opening of the next
______ SETTINGS ______
- Trade Setup:
Here you can choose to trade only longs or shorts and change your Risk:Reward.
You can also decide to adjust your volume per position according to your risk tolerance. With “% of Equity” your stop loss will always be equal to a fixed percentage of your initial capital (will “compound” overtime) and with “$ Amount” your stop loss will always be 'x' amount of the base currency (ex: USD, will not compound)
Stop Loss:
The ATR is used to create a stop loss that matches current volatility. The multiplier corresponds to how many times the ATR stop losses and take profits will be away from closing price.
- Stochastic:
Here you can find the usual K% & D% length and overbought (OB) and oversold (OS) levels.
The “Stochastic OB/OS lookback” increase the tolerance towards OB/OS territories. It allows to look 'x' bars back for a value of the Stochastic K line to be overbought or oversold when detecting an entry signal.
The “All must be OB/OS” refers to the previous “Stochastic OB/OS lookback” parameter. If this option is ticked, instead of needing only 1 OB/OS value within the lookback period to get a valid signal, now, all bars looked back must be OB/OS.
The color gradient drawn between the fast and slow EMAs is a representation of the Stochastic K% line position. With default setting colors, when fast EMA > slow EMA, gradient will become solid blue when Stochastic is oversold and when slow EMA > fast EMA, gradient will become solid blue when Stochastic is overbought
- EMAs:
Just pick your favorite ones
- Reference Market:
An additional filter to be certain to stay aligned with the current a market index trend (in our case: Bitcoin). If selected reference market (and timeframe) is trading above selected EMA, this strategy will only take long trades (vice-versa for shorts) Because, let’s face it… even if this filter isn’t bulletproof, you know for sure that when Bitcoin tanks, there won’t be many Alts going north simultaneously. Once again, this is a trend following strategy.
A few tips for increased performance: fast EMA and D% Line can be real fast… 😉
As always, my scripts evolve greatly with your ideas and suggestions, keep them coming! I will gladly incorporate more functionalities as I go.
All my script are tradable when published but remain work in progress, looking for further improvements.
Hope you like it!

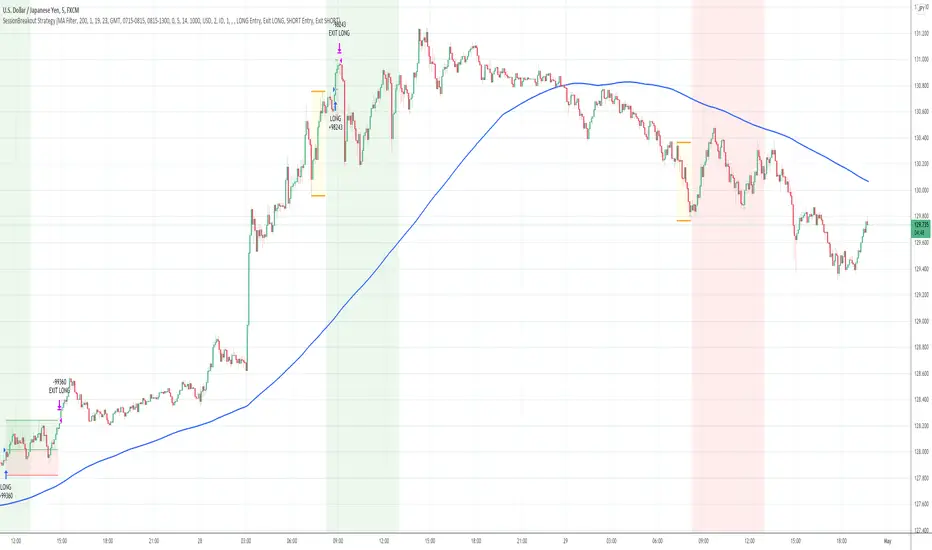
Session Breakout Strategy [Kintsugi Trading]What is Session Breakout Strategy?
This premium indicator was inspired by my desire to find and place high probability forex trades in any market, direction, or time of day.
Why Forex?
The Forex markets operate 24 hours, 5.5 days a week
Access to meaningful leverage
Ability to easily trade long or short
High liquidity
How to use it!
----- First, start by choosing a Range Session and Trade Session. -----
- Range Session = Period of time you believe will be predictive of future price action. I like to overlay 'FX Market Sessions' by boitoki to target timeframes in which forex market sessions overlap. This period is indicative of buyers and sellers battling it out in an effort to choose a direction.
- Trade Session = Period of time you believe the price will act on the information gathered from the range session.
----- Next, we filter the Range Session by information that will help further predict price movement in the Trade Session. -----
Our tools are:
Moving Average Filter
Average RSI Filter
RSI Decision Level
None
Each parameter is customizable.
----- Next, we set our risk. -----
Enter the "stop pip size' you desire.
Enter the 'target profit pip size' you desire.
We can set out ($) dollar risk-per-trade in the inputs. The script does not know your actual account balance, so if you want to risk $100/trade you would enter '$10,000' in the account balance section and '1' in the Risk Per Trade% section.
For example, an '8' stop and an '8' tp would indicate a 1:1 risk-reward. *Note - although you may generate a higher win percent with a less favorable RR, it is rarely worth it.
----- Finally, we backtest our ideas. -----
After using the 'Strategy Tester' tab to thoroughly backtest your predictions you are ready to take it to the next level - Automated Trading!
This was my whole reason for creating the script. If you work a full-time job, live in a time zone that is hard to trade, or just don't have the patience, this will be a game-changer for you as it was for me.
Auto-Trading
When it comes to auto-trading this strategy I have included two options in the script that utilize the alert messages generated by TradingView.
*Note: Please trade on a demo account until you feel comfortable enough to use real money, and then please stick to 1%-2% of your total account value in risk per trade.*
AutoView
PineConnector
Good luck with your trading!
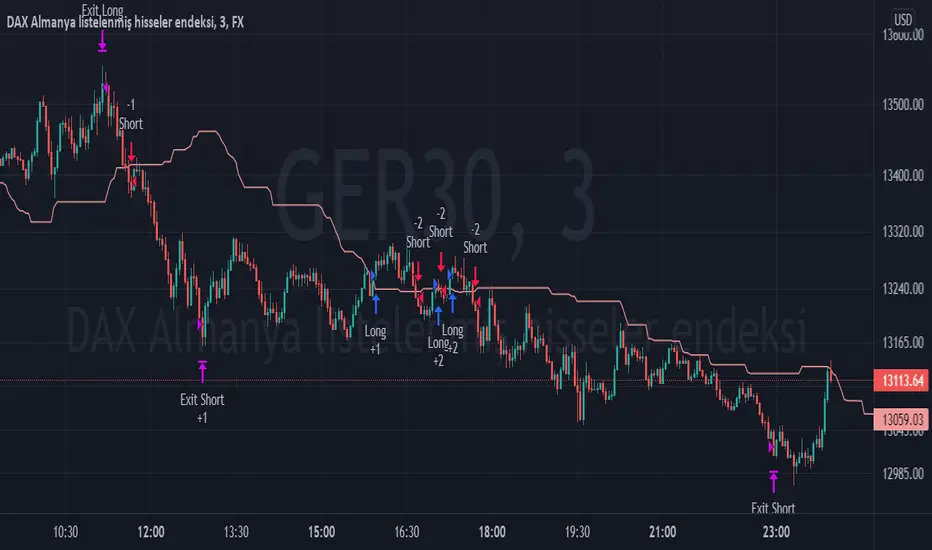
TPS - FX TradeI based my strategy on the Lagging Span 2 line in the Ichimoku Cloud. I actually designed the strategy for the DAX Germany index 3 Minutes period, but you can use it on any instrument you want. I would like to point out some points that you should pay attention to when optimizing the strategy for the instrument you want to use.
Position Take Profit and Stop Loss levels are tick calculations. These values will differ for each instrument. If you are trading in Forex, the values you will write here should be starting from the numbers after the comma in the instrument value. For example, if you want to take profit at "200" points in DAX, you must write "20000" in the Long or Short Take Profit Score field, this applies to the Stop Loss Points, but if you want to take profit or stop loss at 200 points in UKOIL, you must write "200" in the entry part.
Holyscalp v.3 A MACD 15 min trading strategy,
I set two macd trends that must match in trend direction to be traded,
along with that they must follow the moving average trend set in place
the trades trigger with an atr stop loss indicator "atr+" by zedartoftrading to be exact
It automates fully through autoview/oanda broker
the ma breach settings look back however many bars set in place and see if the bars are closing in opposite trend to the moving average
*TIP get another chart with same forex pair and take and change the candle sticks to heikin candles and set chart to 1D and trade only with that trend for the 15min settings, you can disable short trades by setting the threshold limit to 1 and to disable long trades set threshold to -1
Dec 31, 2021
Release Notes: for my use only
an hour ago
Release Notes: It trades based on these parameters I set in place.
1. The long term macd trend and the short term macd trend must match
2. The atr+ can not be more than 3x the previous atr.
3. It must trade with the trend set in place, I have two moving averages to choose from, to disable the second moving average set it to 1.
4. Don't touch the hammer and star fib level leave at zero, need to code that separately
5. the MA breach looks back a certain amount of bars to try and stop trading while its consolidating. I set at 1:0
an hour ago
Release Notes: Just updated the default settings, Remember they are set for optimization for 15mins but the same rules and parameters still apply to longer time frames, just change the moving averages to your liking if you want to move up timeframes.

Contrarian Scalping Counter Trend Bb Envelope Adx and StochasticContrarian Scalping is an trading strategy designed to take advanted of a counter-trend.
The advantage of these strrategies types is that they have a good profitability but with do not great gain (in relation at the time frame).
Indicators used:
Bollinger
Envelope
ADX
Stochastic
Rules for entry
For short: close of the price is above upper band from bb and envelope, adx is below 30 and stochastic is above 50
For long: close of the price is below lower band from bb and envelope, adx is below 30 and stochastic is below 50
Rules for exit
For short: either close of the candle is below lower band of bb or enveloper or stochastic is below 50
For long: either close o the candle is above upper band of bb or envelope or stochastic is above 50
If there are any questions let me know !

BollingerBands Strat + pending order alerts via TradingConnectorSoftware part of algotrading is simpler than you think. TradingView is a great place to do this actually. To present it, I'm publishing each of the default strategies you can find in Pinescript editor's "built-in" list with slight modification - I'm only adding 2 lines of code, which will trigger alerts, ready to be forwarded to your broker via TradingConnector and instantly executed there. Alerts added in this script: 14, 17, 20 and 23.
SCRIPT INCLUDES PENDING ORDERS AND ALERTS! Alert will be sent to MetaTrader when order is triggered, but not yet filled. That means if market conditions change and order does not get filled, it needs to be cancelled as well, and there are alerts for that in the script as well.
How it works:
1. TradingView alert fires.
2. TradingConnector catches it and forwards to MetaTrader4/5 you got from your broker.
3. Trade gets executed inside MetaTrader within 1 second of fired alert.
When configuring alert, make sure to select "alert() function calls only" in CreateAlert popup. One alert per ticker is required.
Adding stop-loss, take-profit, trailing-stop, break-even or executing pending orders is also possible. These topics have been covered in other example posts.
This routing works for Forex, indices, stocks, crypto - anything your broker offers via their MetaTrader4 or 5.
Disclaimer: This concept is presented for educational purposes only. Profitable results of trading this strategy are not guaranteed even if the backtest suggests so. By no means this post can be considered a trading advice. You trade at your own risk.
If you are thinking to execute this particular strategy, make sure to find the instrument, settings and timeframe which you like most. You can do this by your own research only.
